Teams Quality User Guide
Overview
This DEX Pack offers a proactive evaluation of Teams Call Quality. Use this dashboard to review where in your organization that your users could potentially experience poor Teams calls.
The pack uses a collection extension in combination with the official Microsoft Teams Network Assessment Tool, which can be automatically deployed via InTune. It periodically simulates a real media stream to Teams media relays (specific to your systems) to assess key metrics such as jitter, latency, and packet loss, all of which can impact call quality. To begin collecting data, the Microsoft tool must be deployed to the target systems.
The collection extension data will also feed three Teams Quality Fail sensors for jitter, latency, and packet loss.
The collection extension provided with this pack utilizes a third party data processor which is outside of the SysTrack cloud environment. The collection extension uses a script which determines the system local connection egress IP, and the egress IP detected by the Teams media relay. Both IPs are then transmitted to the public API service from RIPEStat to determine the ISP ownership and location information registered against the IP.
How This Feature Helps You
Some of the benefits you will get with this are:
Averages
This is across everyone in your organization that is running this test based on the Average Jitter (ms), Average Latency (ms), and Average Loss Rate (%) that is being experienced.
Average Jitter - This is the average change in delay between successive packets. Most modern VoIP software including Microsoft Teams can adapt to some levels of jitter through buffering. It's only when the jitter exceeds the buffering that a participant notices the effects of jitter.
Average Latency - This is the time it takes to get an IP packet from point A to point B on the network. This network propagation delay is tied to physical distance between the two points and the speed of light, including extra overhead taken by the various routers in between. Latency is measured as one-way or Round-trip Time (RTT).
Average Loss Rate - This is often defined as a percentage of packets that are lost in a given window of time. Packet loss directly affects audio quality—from small, individual lost packets having almost no impact, to back-to-back burst losses that cause complete audio cut-out.
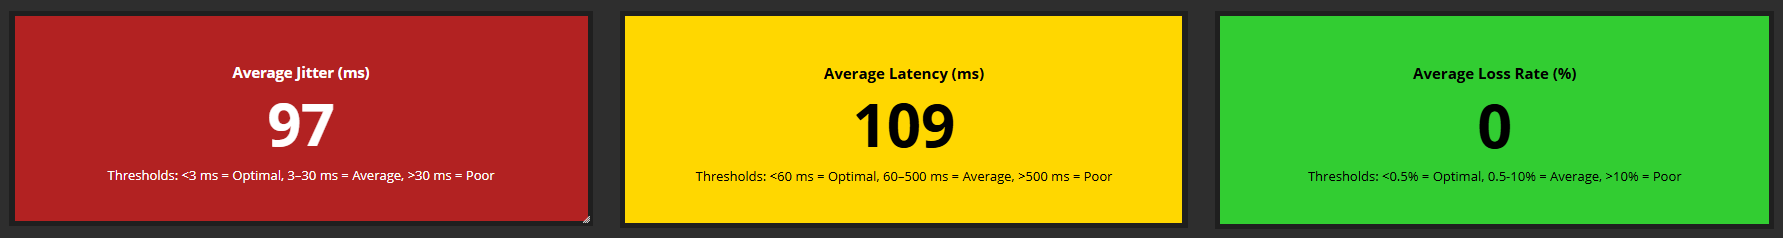
Metrics Measured:
Poor = Red
Average = Yellow
Optimal = Green
These are the thresholds for each metric, as defined by Microsoft.
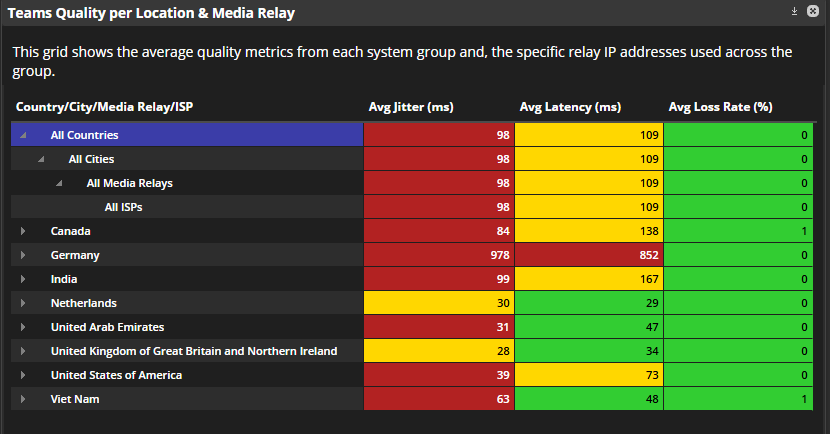
Teams Quality per Location & Media Relay
You can monitor and assess the quality of Microsoft Teams calls based on factors such as location, media relay, and network conditions. This helps to proactively identify and address potential issues before you are impacted.
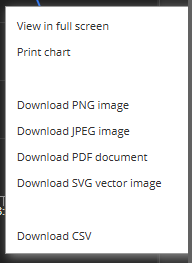
Click the down arrow to export the information to a .CSV file.
The tests are broken down into different countries.
You can click from Country to City to Media Relay (which is the Teams' server) to ISP.
That way you can start to see which ISP's, locations, or media relays could be responsible for a bad connection.
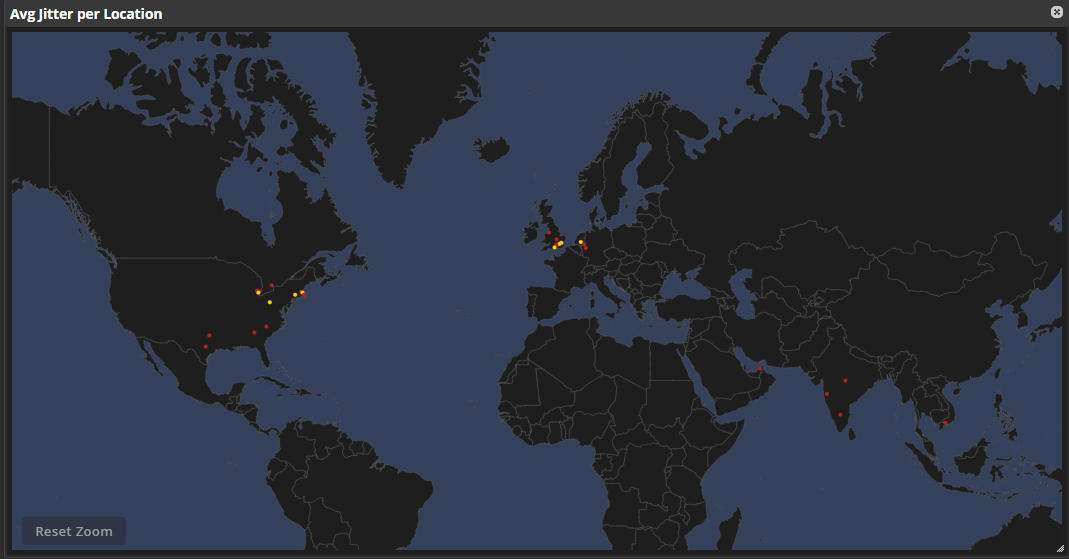
Avg Jitter per Location
A map with average jitter per location that plots the variation in packet delay across different geographical locations. You can zoom in to a country or region by selecting the row in the grid to the left.
Systems
When you click on a country, you can drill down to specific cities, which will show in the Systems grid. This will show more granular information around the tests that have been run from those systems.
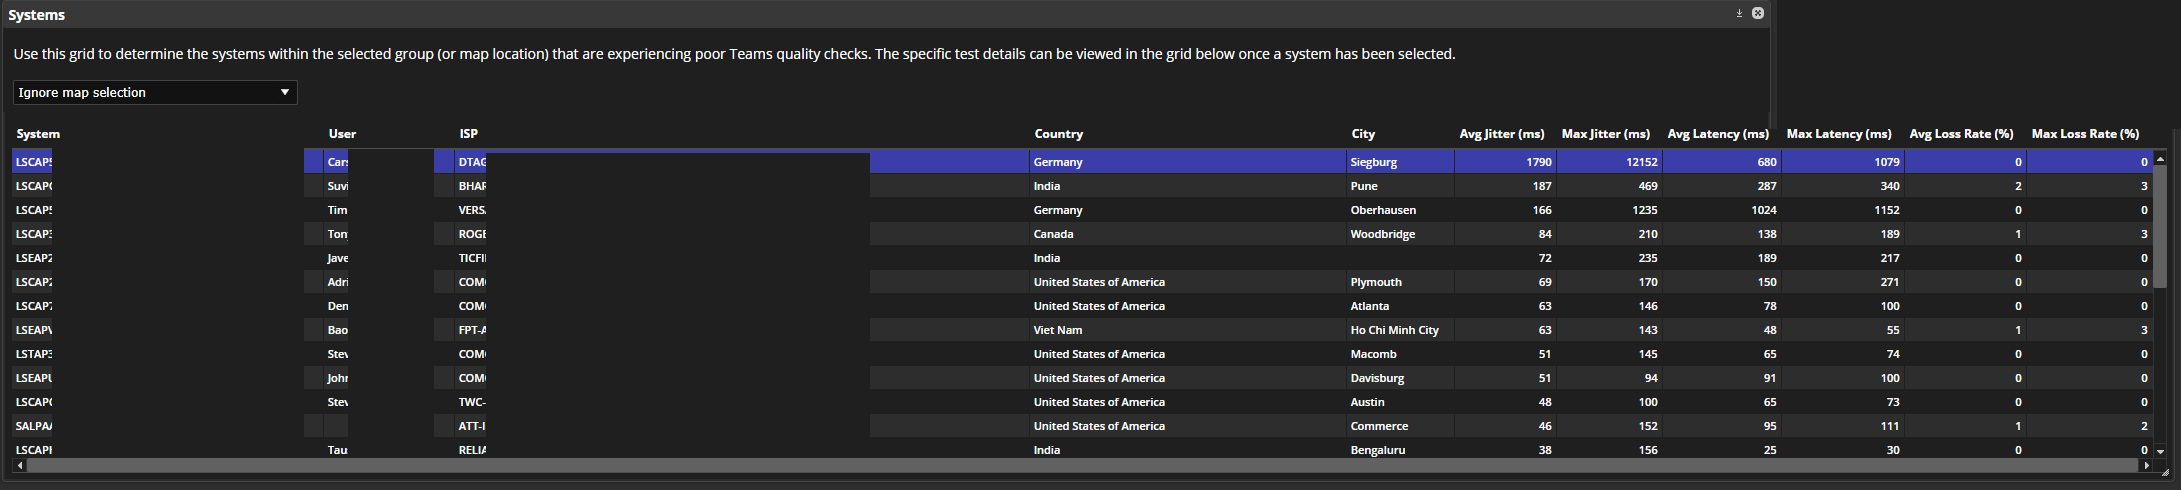
The drill down works for any selection in the table. For example, if you expand the Canada row to Toronto and expand that to 156.24.xxx.xx, then the table will show systems in Toronto, Canada that have connected through media relay 156.24.xxx.xx. The map selection is ignored by default. To enable that, you have to set the drop-down at the top of the Systems table to Show systems based on map selection.
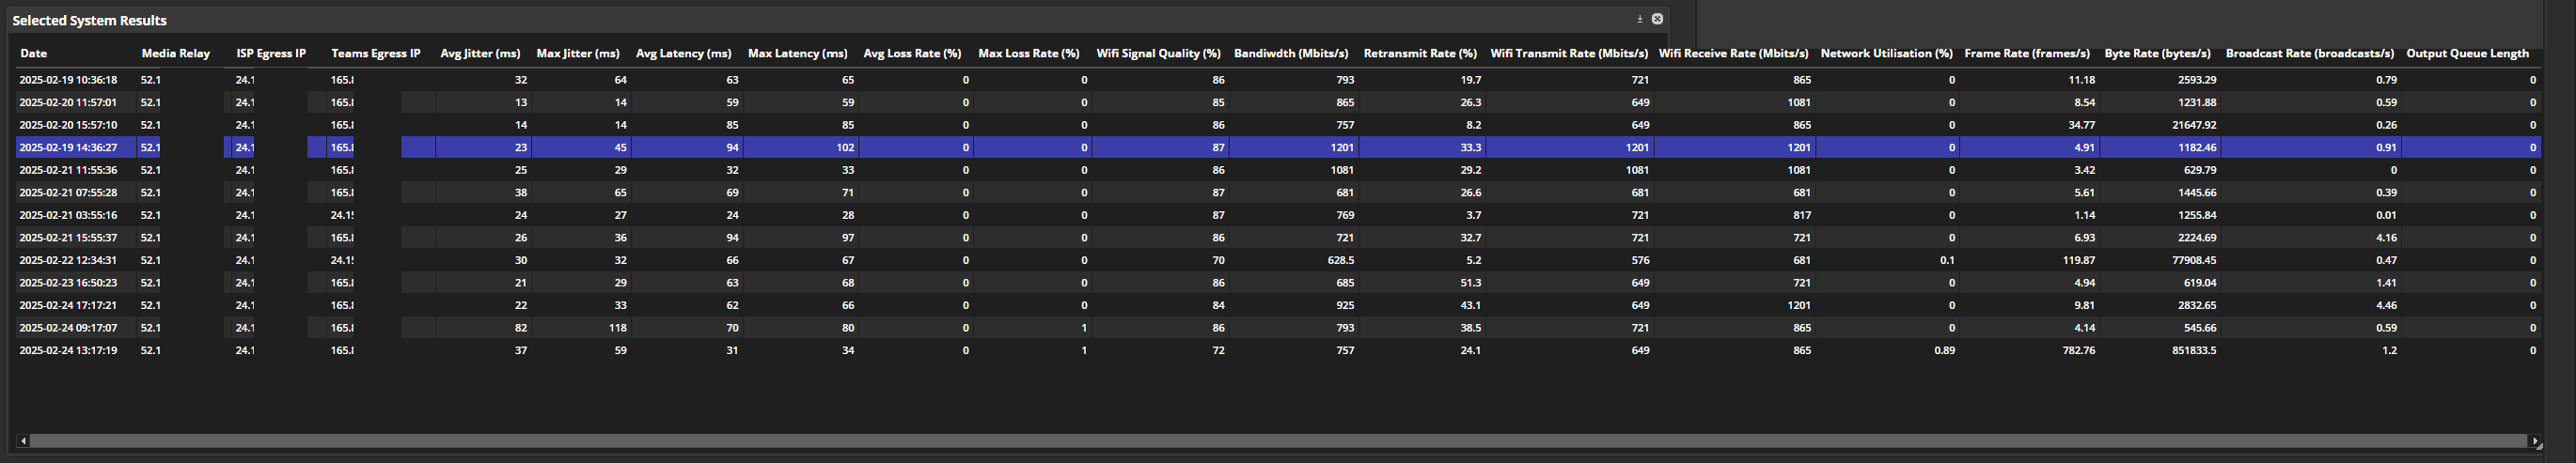
Selected System Results
Once you select a system, you can review the results to see what is contributing to the issues.
Selected System & Metric
You can see a graph of the jitter and the latency over time for the user.
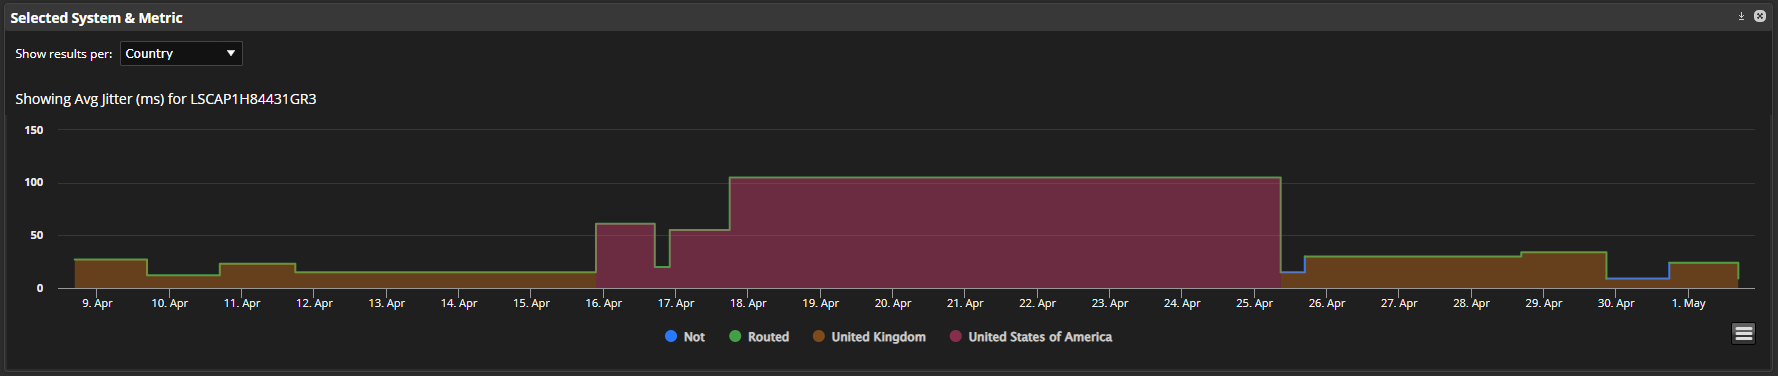
The graph allows you to see the selected metric trend over time for the system, provides Country/City/ISP information, and if the connection was routed. A routed connection is defined by the egress IP of the system (internet facing IP) and the egress IP detected by the Teams media relay being different.
The shading on the graph indicates the Country/City/ISP the tests are being run from, the color of the line indicates if it is or is not routed, and the line value is the selected metric.
On This Page